Flow view: see the bottleneck
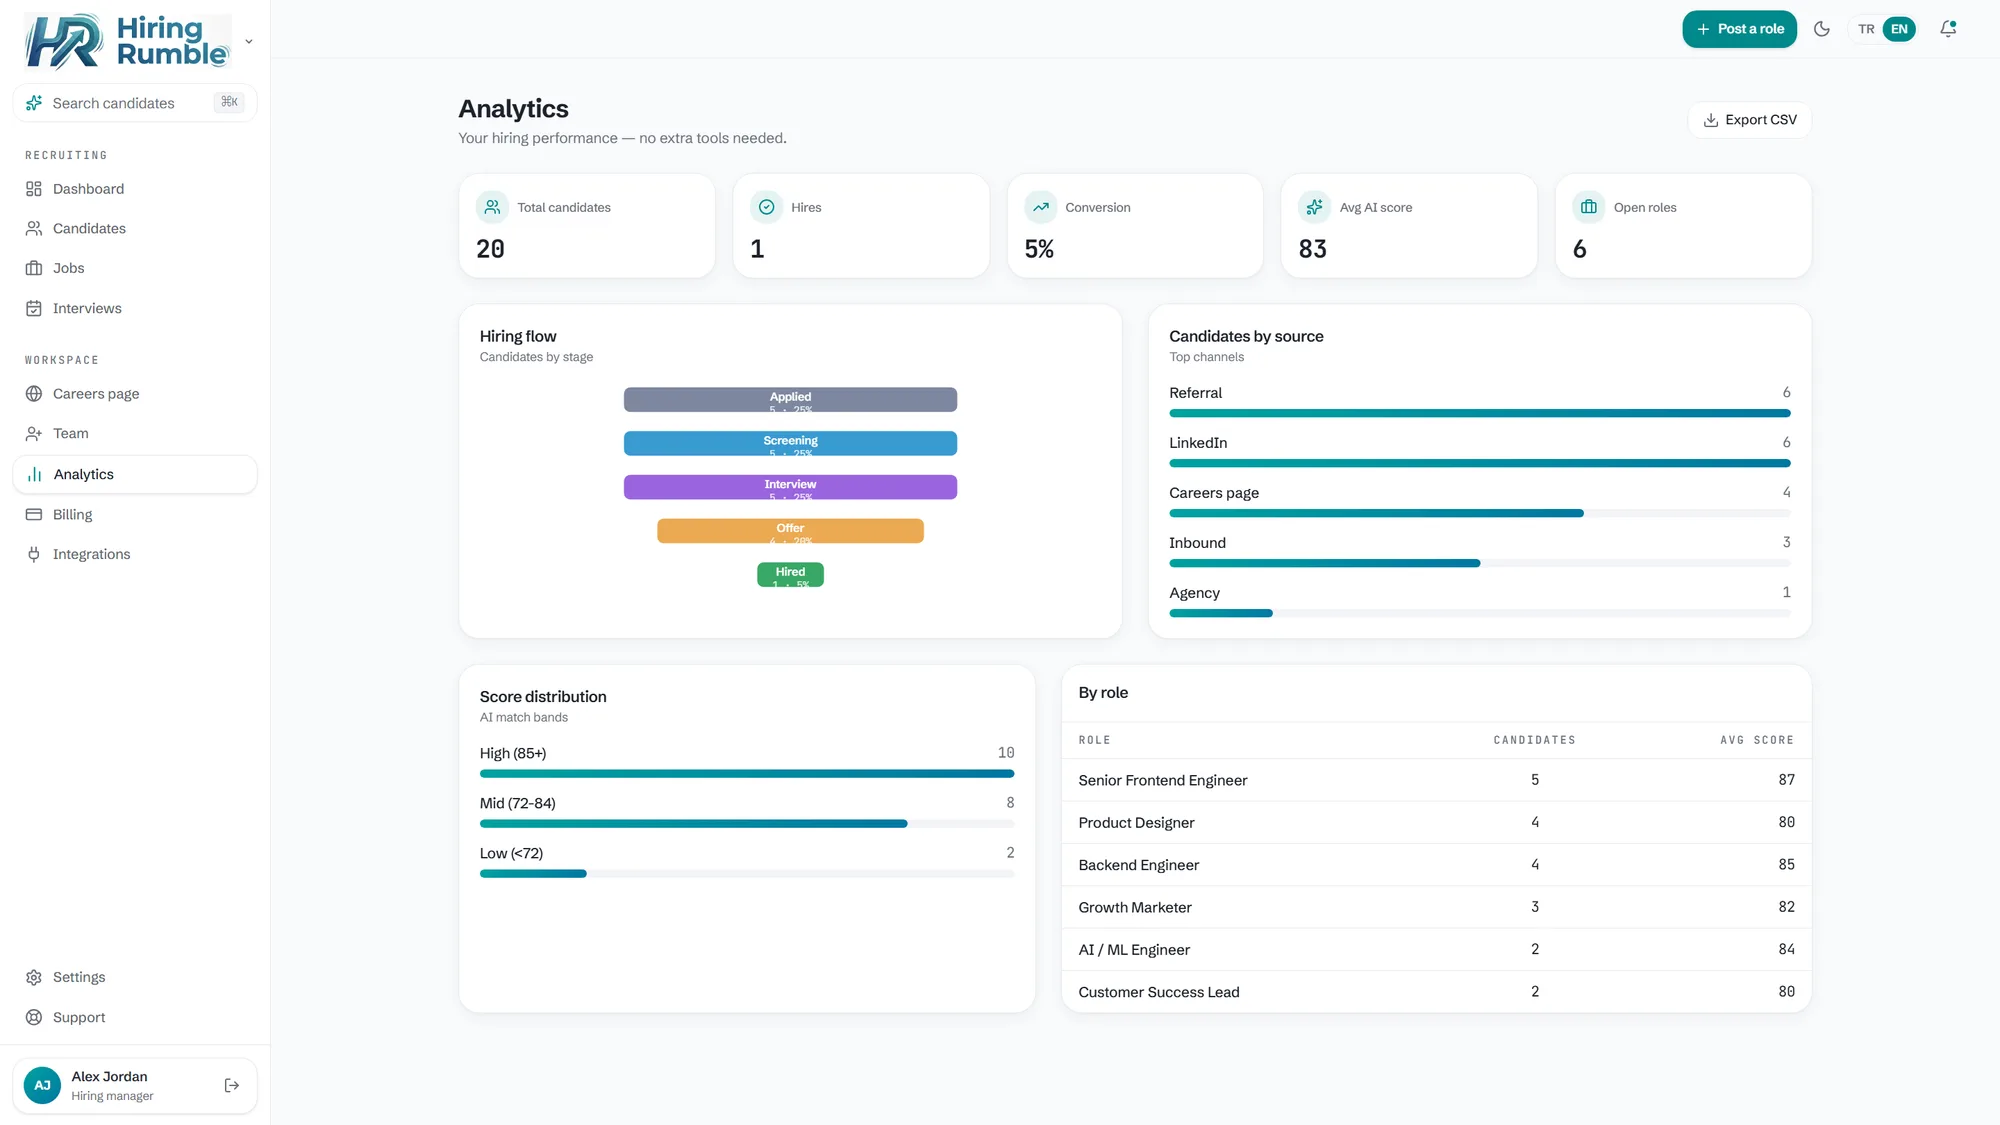
See the conversion rate of every stage from application to hire. Are candidates piling up in Screening, or are you losing them at Offer? Find the problem with data, not guesses.
- Per-stage conversion rates
- Flow comparison across jobs
- Trend charts over time
Source quality and score distribution
Careers page, referrals or imports — which source brings high-scoring candidates? Source data combined with AI scores tells you where to put your job-ad budget.
- Volume and quality per source
- AI score distribution chart
- Referral program return
A daily pulse on the dashboard
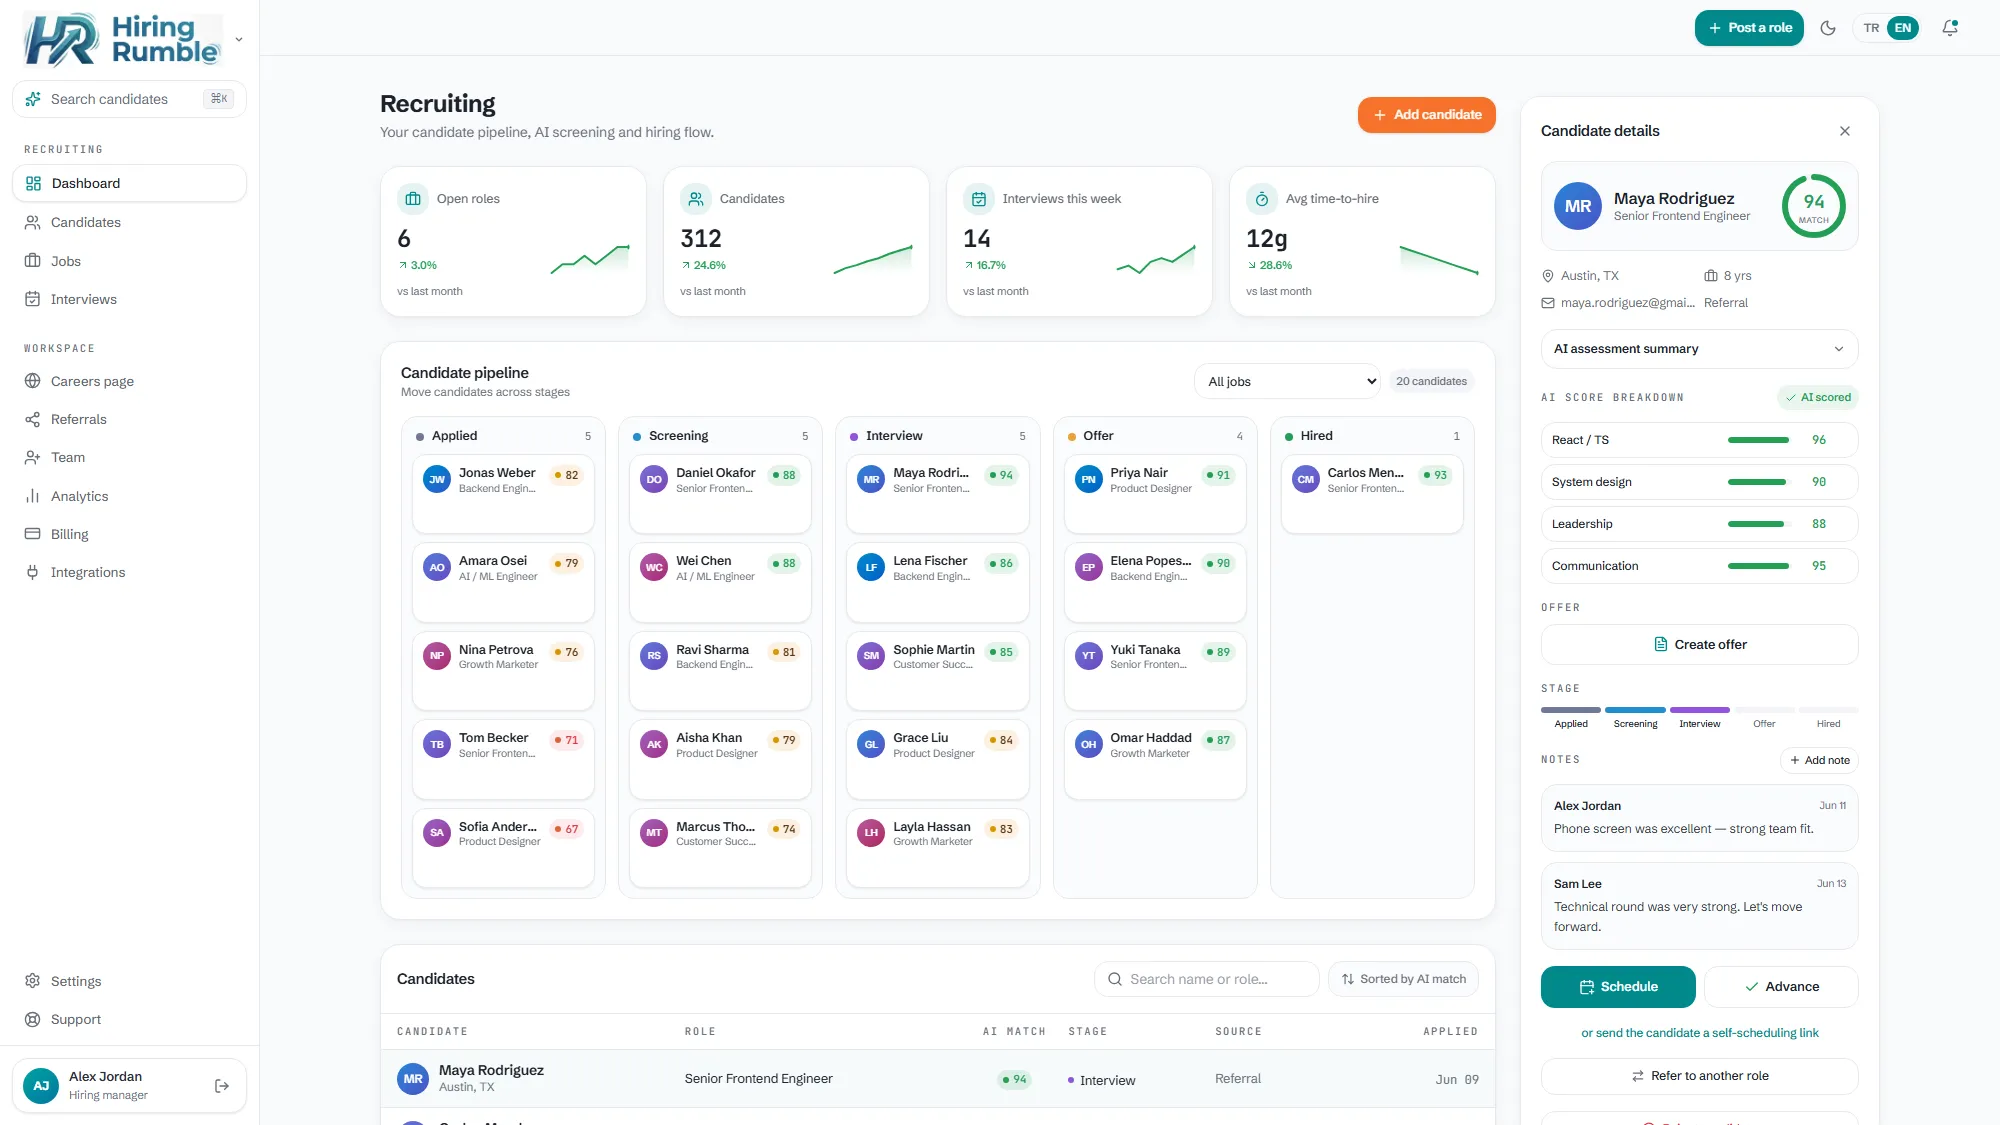
The main dashboard shows today at a glance: open roles, new applications, upcoming interviews and process KPIs. Start the day knowing where to focus.
- Open role and application counters
- What's pending: interviews, offers, replies
- KPI trends at a glance
Frequently asked questions
Can I export reports?
Yes — export your analytics data to CSV in one click. Dashboards run on live data, and screenshots work well for management updates too.
How far back does the data go?
All application and stage history is kept from day one; charts render for the range you select.
Who on the team sees analytics?
Analytics is available to admin and recruiter roles; interviewers don't see process metrics.